Actionable
Intelligence Platform
Dashboard Builder
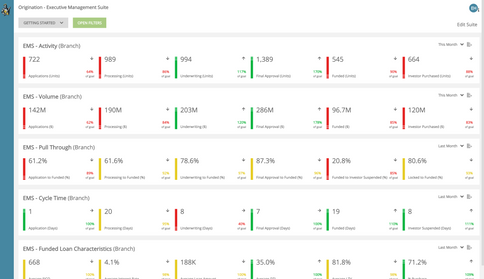
The actionable intelligence platform is the next generation of business intelligence by Black Knight inc. for mortgage banks and firms. Using data pulled in from their platforms, they are able to easily view and drill into their data to ensure they are being as efficient as possible.
For this project, I worked closely with clients to discover current pain points of the existing platform. The end result was drag and drop dashboard builder with quick and easy end user filtering functionality.

Skills Used
User Interviews
Card Sorting
Roadmap Strategy
Design System Creation
Sketch
Invision
Usability Testing
User-Centric Results
The goal of this project was to simplify and update the way system admins created dashboards. Ideally, we wanted to make it simple enough that branch managers and executives could even create custom dashboards on demand, instead of asking their system admins every time. Our previous dashboard builder took 2 days of intense training to fully learn, and even after training, many admins would still need help from our account managers.
I began collecting requirements from our clients throughout various user interviews - during this process, I met with both admin and executive users to ensure that both personas were being heard. I also met with our internal account managers to get to discover frequent issues they saw. Once requirements were gathered, I created lo-fi wireframes that were presented back to our clients who were initially interviewed. I was able to show them the eventual drag and drop functionality and watch them navigate on the wireframes.
A large part of this testing also included card-sorting to work on our organizational structure of every element. Since our platform had a variety of users and iterations, there were a lot of acronyms and shortcuts that not every user knew - card-sorting helped show this to our shareholders which eventually lead to us simplifying the language on the platform.
Once this research was concluded, the project manager and I met with our architecture and development teams to review all functionality to ensure that all security and development standards were being met. Finally, I created the Prototypes below which were tested on a second group of our admin and executive users, as well as internal account managers. I tested these final prototypes with a completely new group so that our testing would be free of any bias.

INITIAL RESEARCH
During the initial research phase, I created a "war room" and while interviewing clients, I would categorize all their ideas or pain points with post-it notes and place them on a whiteboard. This helped the team organize and visualize all feedback. This also helped keep ideas anonymous - they could only tell if it was an admin or executive.

PAIN POINT 1: PROPERTIES & SECURITY
One of the largest pain points we discovered during interviews was how unnecessarily confusing the basic properties and security settings were on a dashboard. Security was extremely important to our users and once we broke it out to a simple multi-select they were able to quickly see who had access to this dashboard. Eventually, they were even able to create new security groups from this screen.

PAIN POINT 2: ADDING VISUALIZERS
Previously, our clients had very limited options when it came to arranging and customizing visualizers on their dashboard. We learned they wanted to be able to do whatever they wanted when it came to arranging and sizing their visuals. To solve this, I designed a drag and drop dashboard, where the user could easily drop any component onto their dashboard and quickly resize by dragging the corners of their visualizer.

PAIN POINT 3: CREATING VISUALIZERS
We learned that our clients were often frustrated building new visualizers as they were unable to see a real-time preview. To solve for this, we created a visualizer builder inside the dashboard builder that allowed for creating new and editing existing visualizers with drag-and-drop functionality and a real-time preview of their graph.
End-User Screens


